PyGitGraph: Managing and Analyzing GitHub Issues with Python and GraphQL
GitHub Issues record bugs, feature requests, assignments, and project decisions. That history can show how work moves through a repository, but collecting related comments, labels, and events through fixed REST endpoints may require many paginated requests.
I built PyGitGraph to make that collection easier. The open-source Python tool uses GitHub's GraphQL API, which lets a client request related fields together, and turns the response into data that pandas can analyze.
Navigate this post
Why GitHub Issues Matter
GitHub Issues serve as central tracking hubs for software projects. Development teams use issues to capture bug reports, prioritize backlog items, assign work, and organize sprints. Modern GitHub projects support multiple visual representations to fit different workflows.
- GitHub Issues
-
An integrated tracking system within GitHub repositories used to manage tasks, enhancements, and software bugs.
- GraphQL API
-
A query language for APIs that allows clients to request exactly the data structures they need in a single HTTP call.
- REST API
-
Representational State Transfer API, an architectural style that exposes fixed endpoints for web service resources.
- Cursor Pagination
-
A data fetching strategy using opaque pointers (cursors) to retrieve consecutive pages of results deterministically.
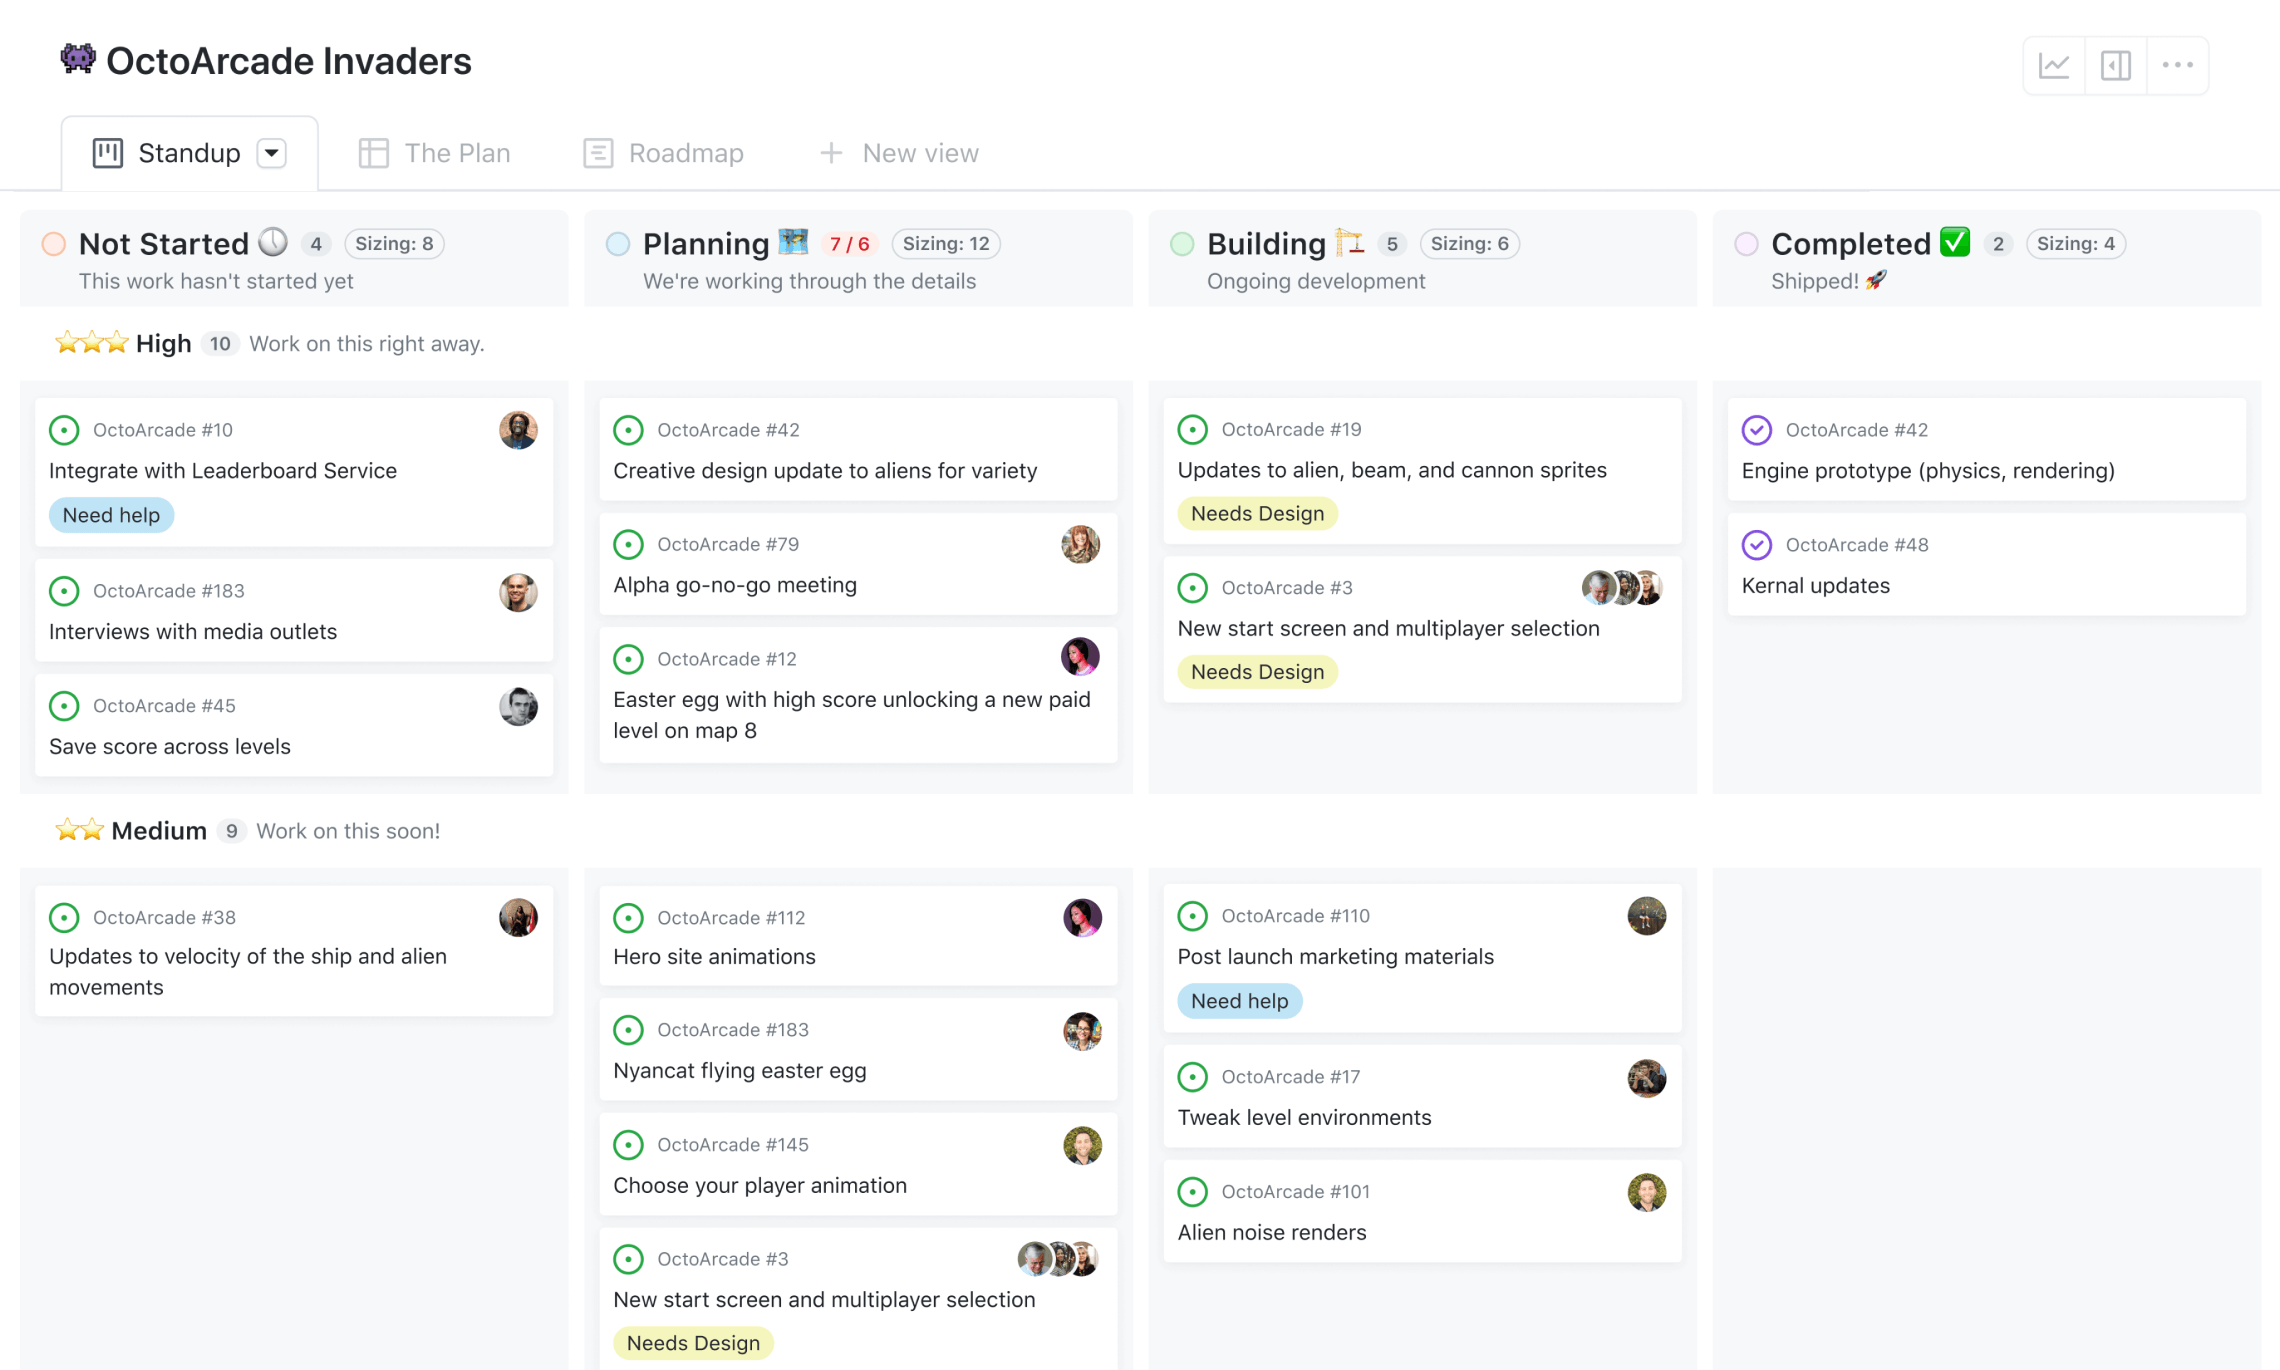
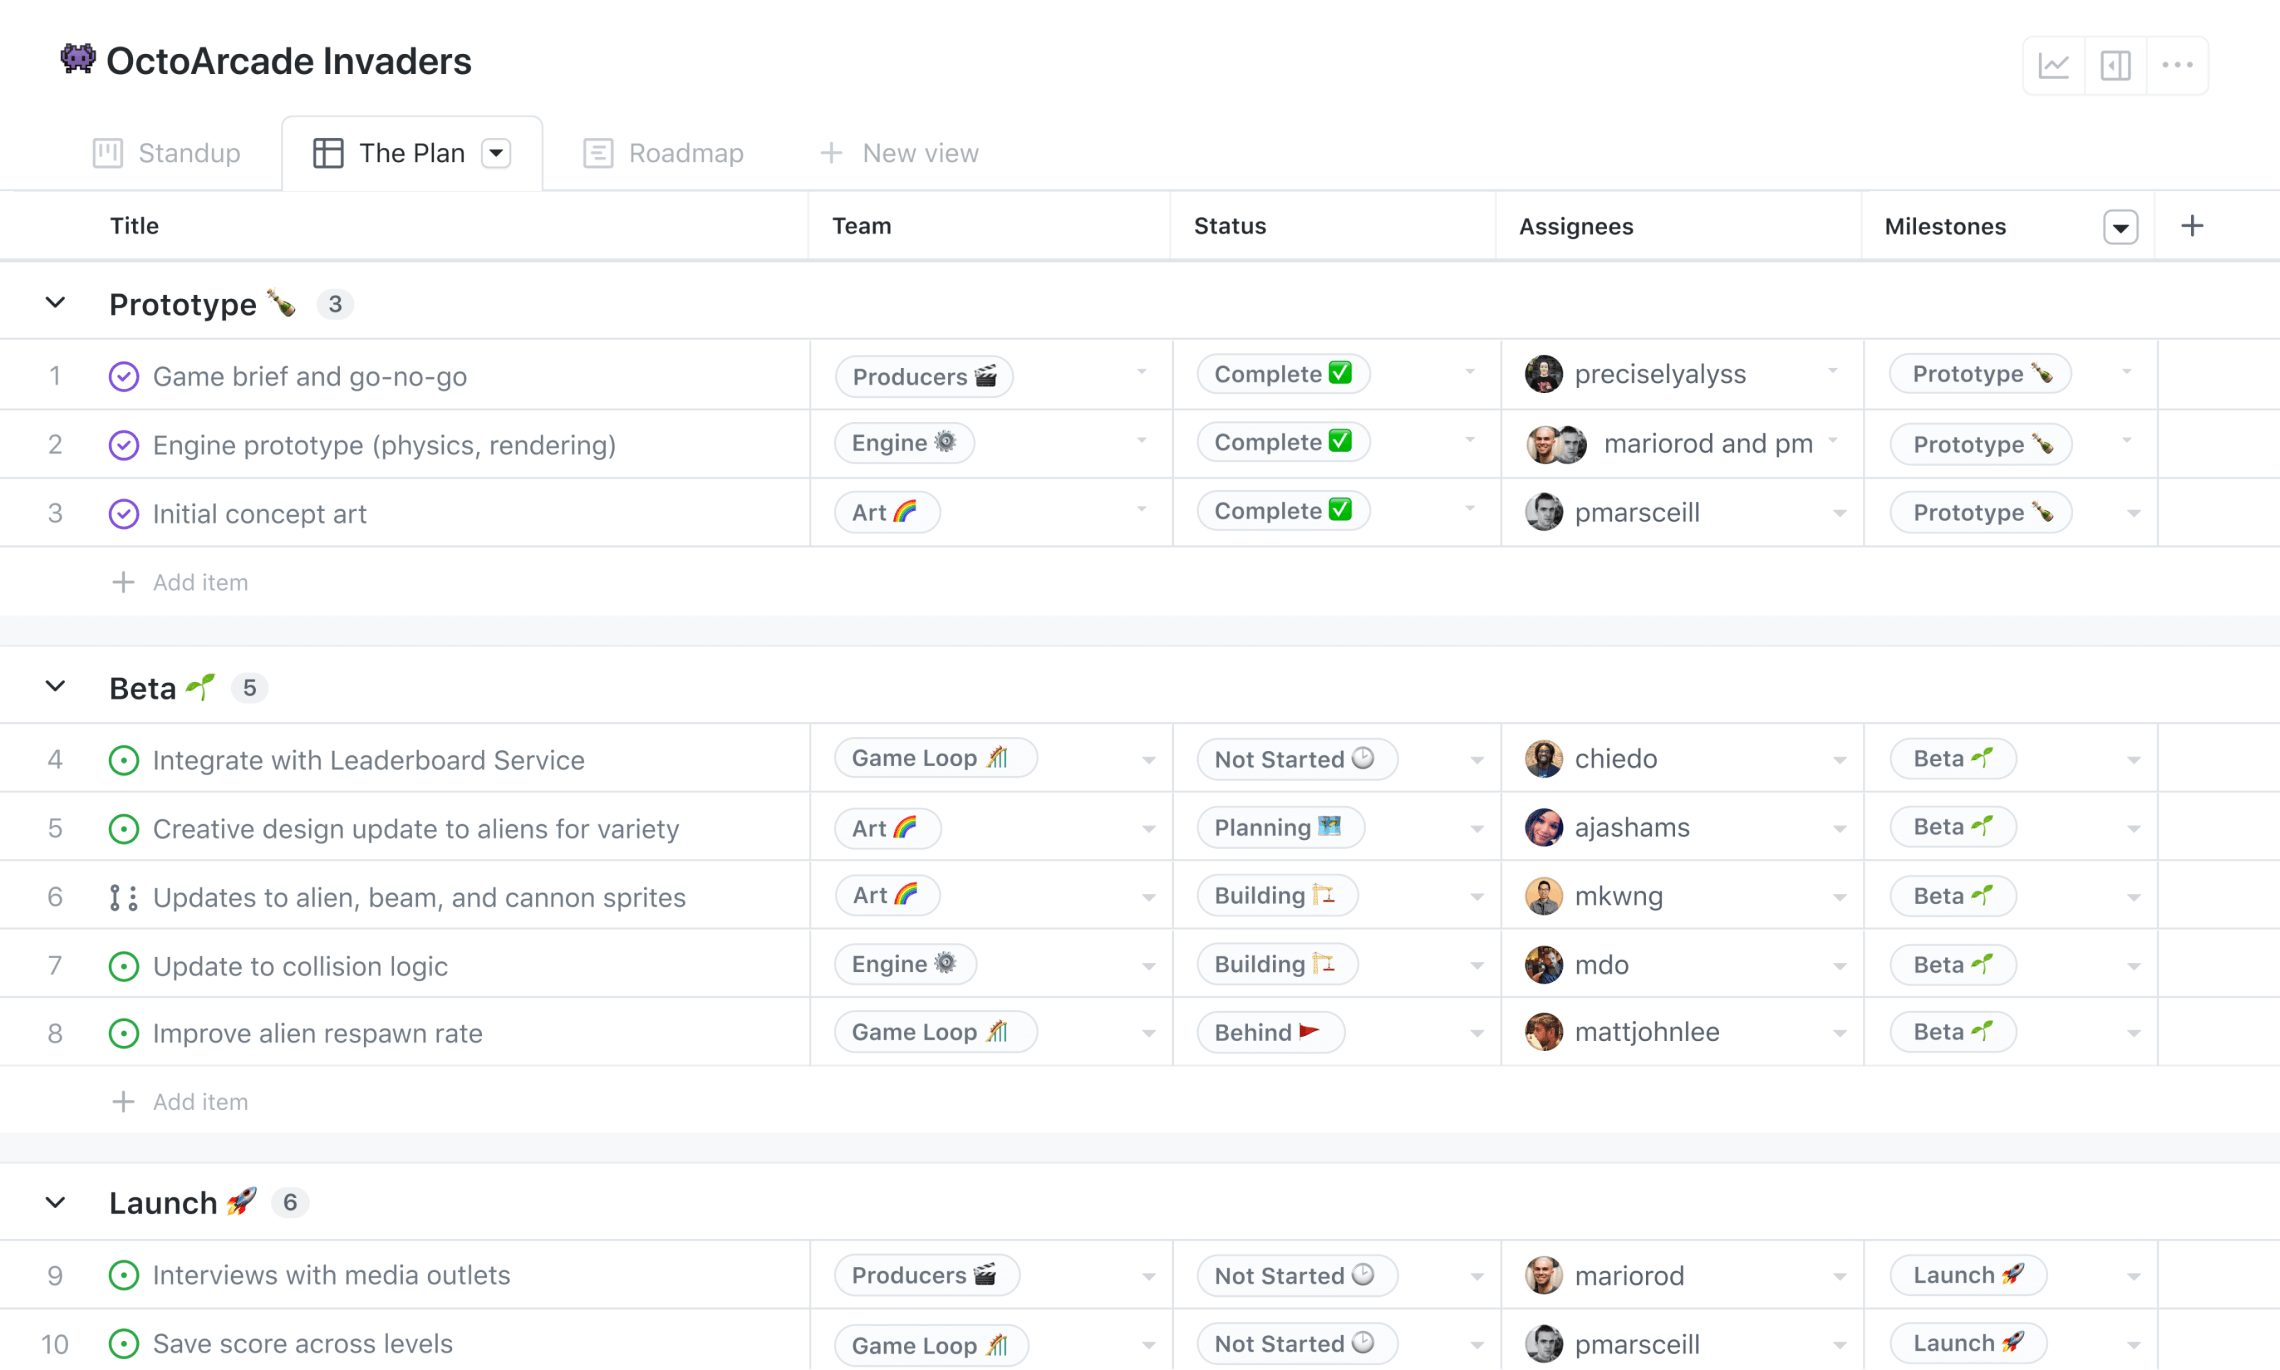
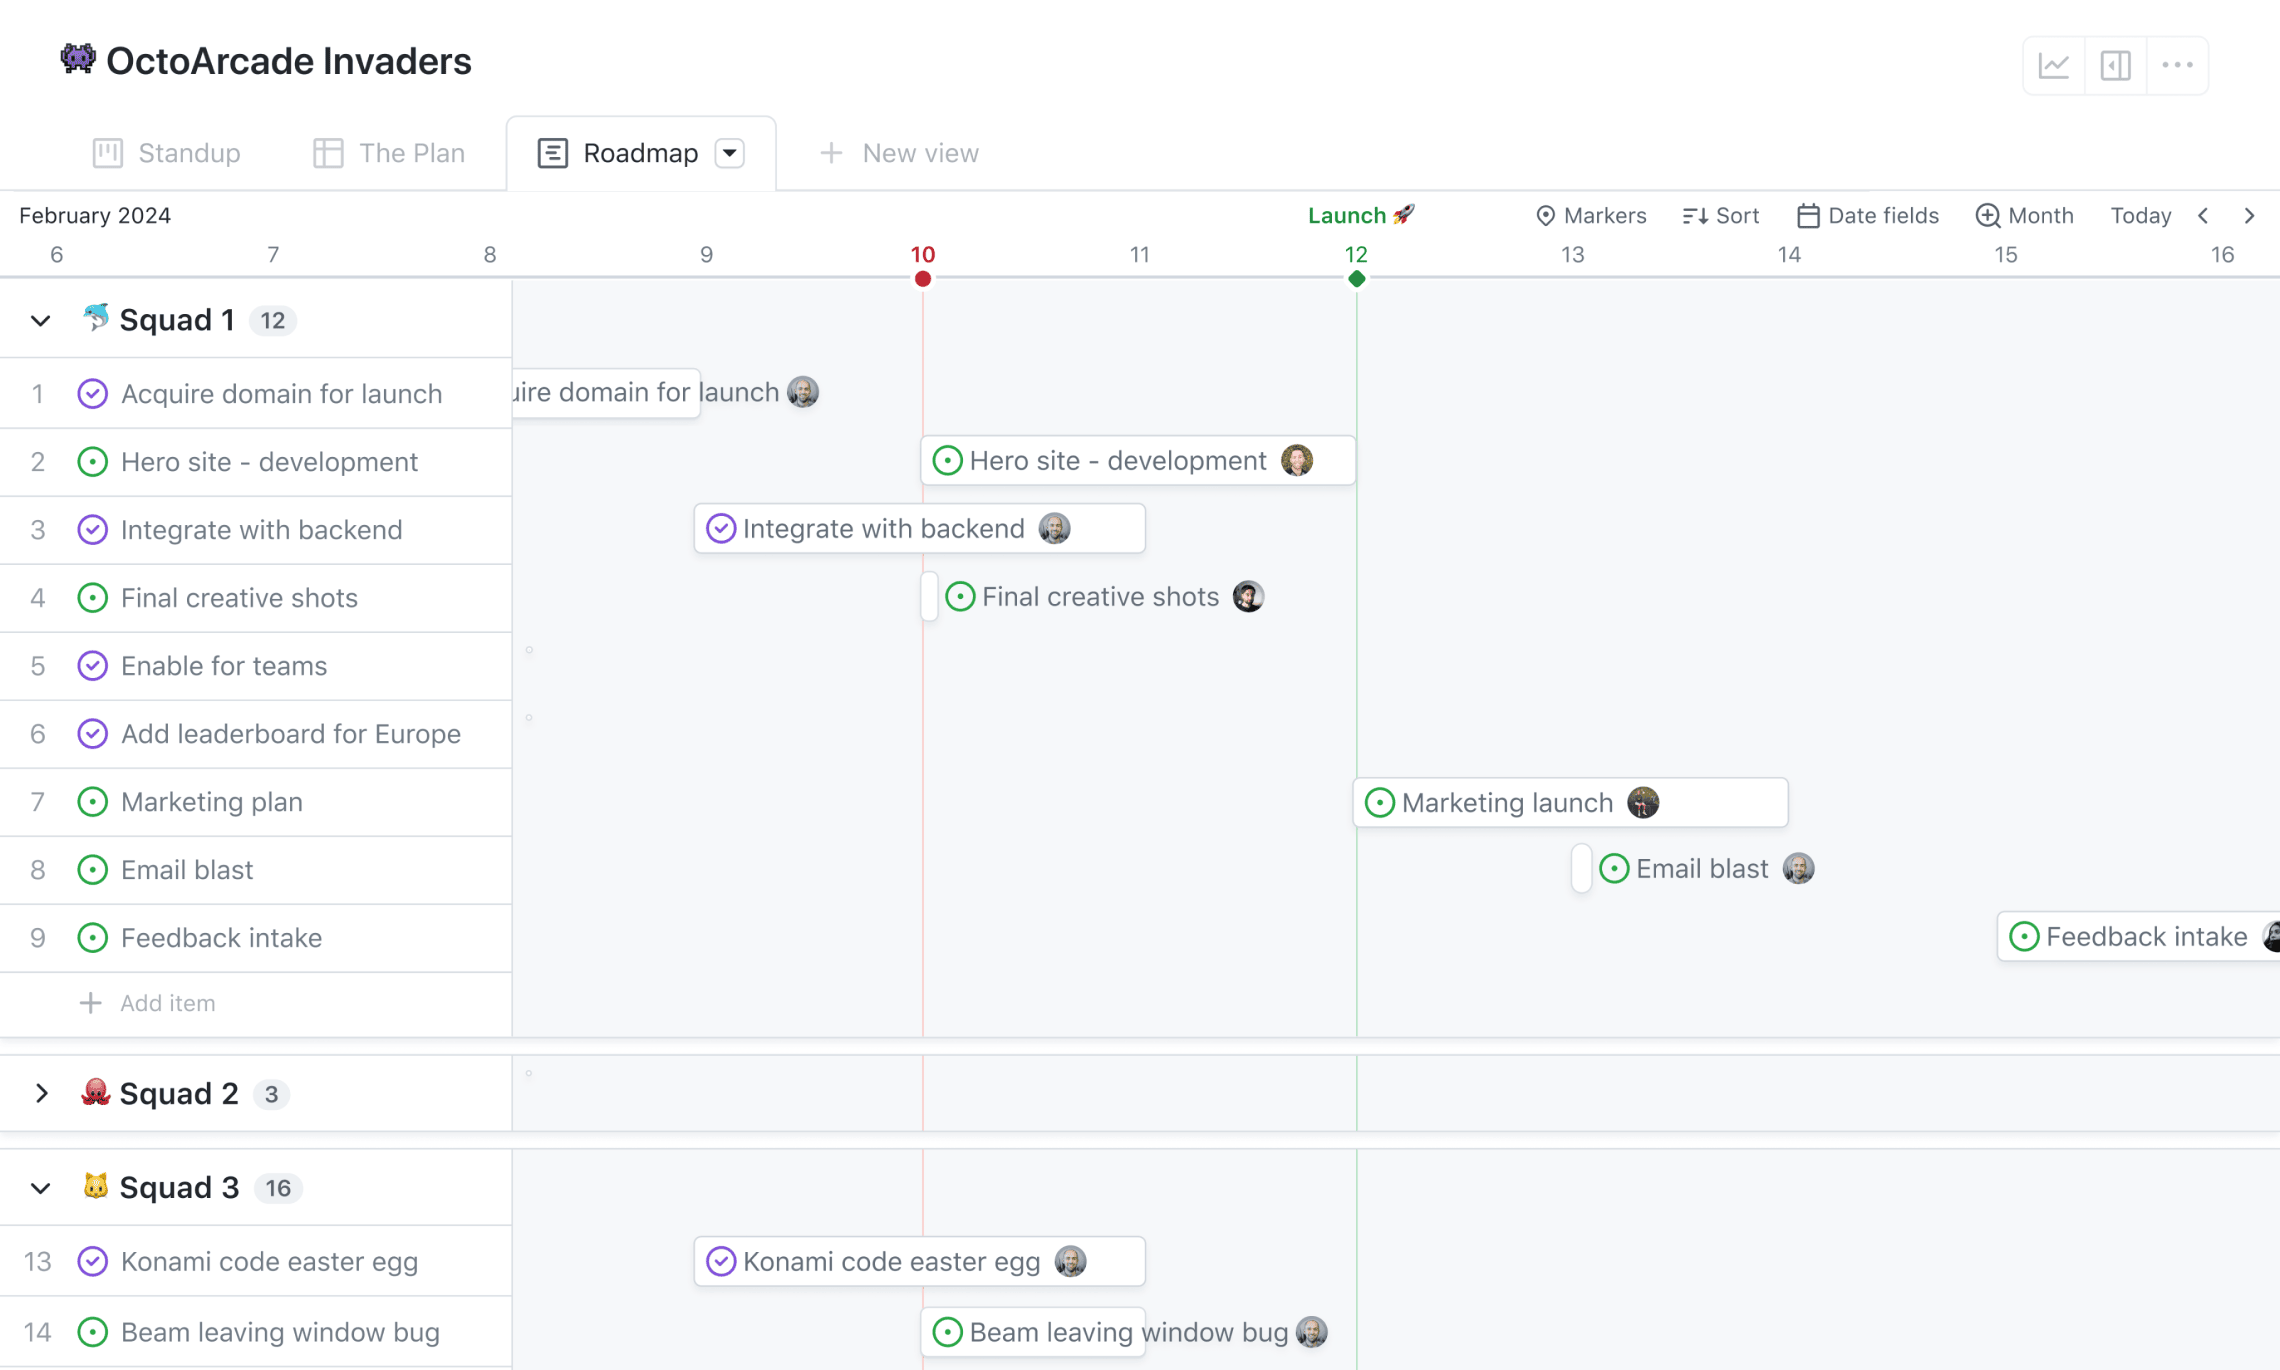
Teams manage work across flexible project views provided natively by GitHub.
Native GitHub Issue Project Views
Track tasks across progressive workflow states like To Do, In Progress, and Done.
View issues in customizable tabular formats with fields for assignees, status, and custom labels.
Visualize long-term project timelines and milestone deadlines on a Gantt chart layout.
Extracting Value from Issue Data
Because GitHub Issues contain rich history including creation timestamps, labels, author details, comments, and resolution dates, extracting this data enables engineering managers to gain actionable project insights.
Analyzing extracted issue datasets helps answer critical operational questions:
- Which feature areas generate the highest volume of bug reports?
- What is the median time required to close high-priority issues?
- How do issue creation and closure rates trend across release cycles?
- What common themes emerge from issue titles using text mining and word clouds?
Visualizing issue data transforms raw logs into clear management dashboards.
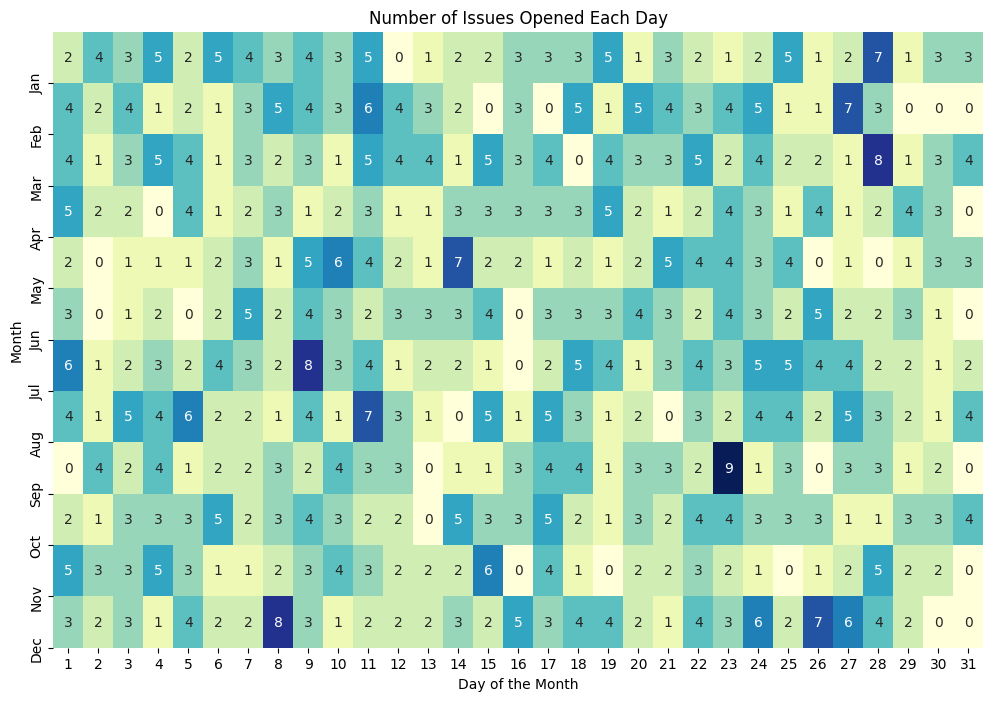
Analytical Visualizations from GitHub Issue Extracts
Daily distribution heatmap showing issue creation intensity across months.
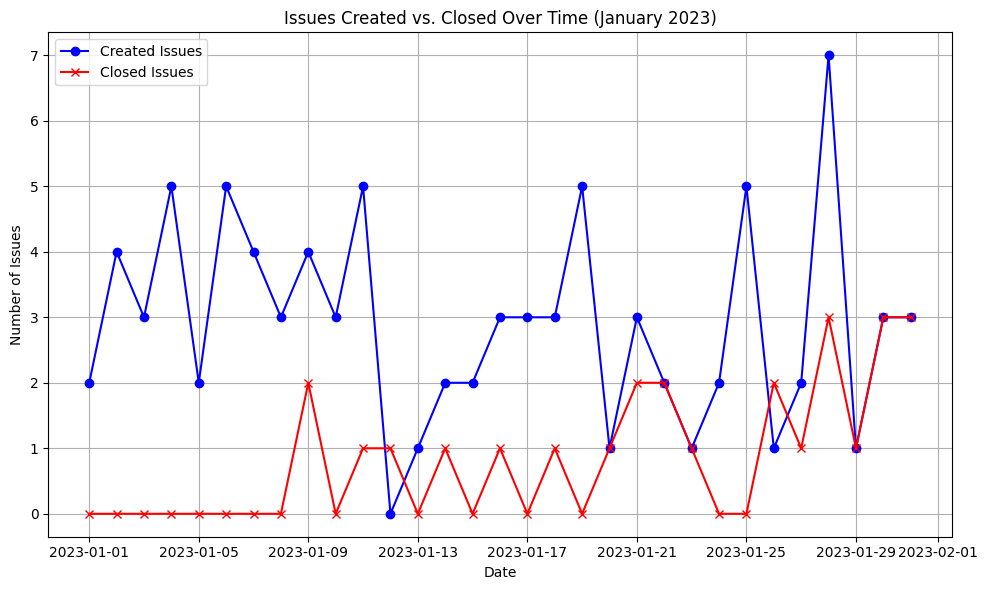
Line chart tracking issues created versus issues closed over time.
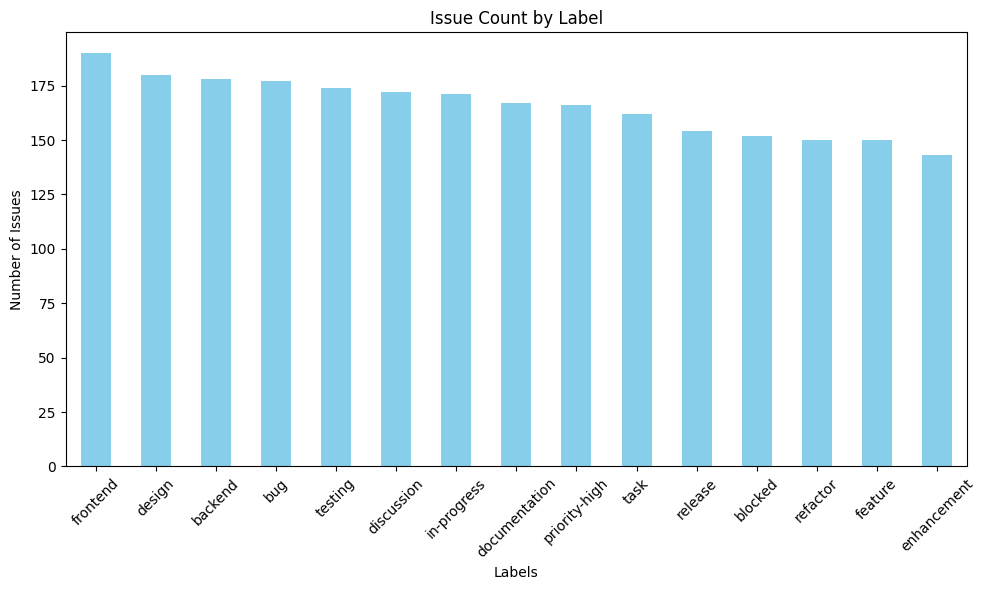
Bar chart categorizing total issue counts by assigned repository labels.
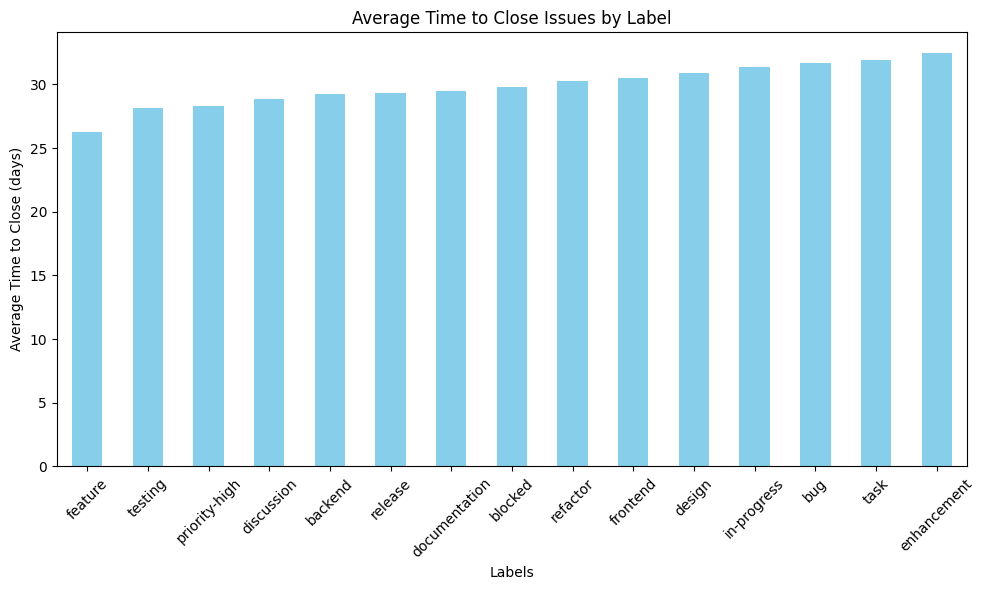
Average duration in days required to close issues grouped by label.
Text frequency word cloud extracted from issue titles and descriptions.
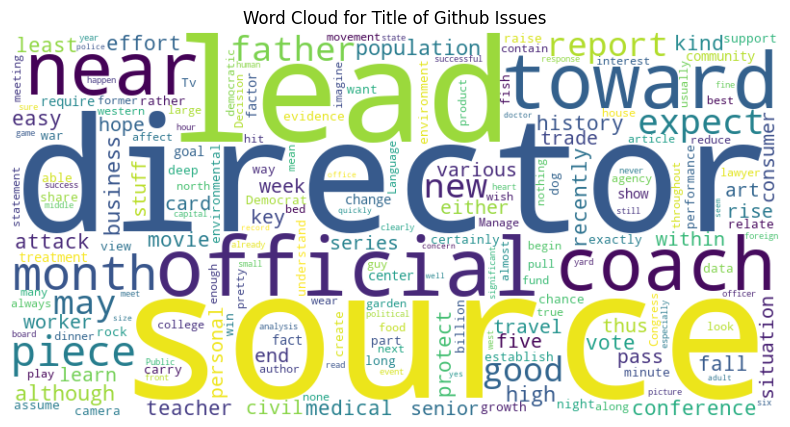
The charts above illustrate how aggregated issue metrics provide early visibility into workload spikes and resolution velocity across development teams.
The Data Extraction Bottleneck
Extracting thousands of historical issue records through GitHub's standard REST API creates performance bottlenecks. REST endpoints return fixed payloads containing excessive metadata, requiring multiple HTTP round-trips to retrieve associated labels, authors, and comments.
GitHub's GraphQL API solves this bottleneck by enabling precise data queries.
| Metric / Feature | REST API v3 | GraphQL API v4 | PyGitGraph Advantage |
|---|---|---|---|
| Data Payload | Fixed schema, returns unneeded fields | Precise query schema, requests exact fields | Reduces payload size up to 80% |
| Request Efficiency | Multiple requests for nested data | Single query fetches issue, comments, and labels | Fetches nested data in one request instead of sending multiple round-trips |
| Pagination Limit | 30 to 100 items per page | 100 items per page with cursor pagination | Automated cursor iteration |
| Rate Limit Impact | Counts per HTTP request | Measures query complexity cost | Built-in rate limit and cost tracking |
As shown in the comparison table, GraphQL allows applications to fetch nested resources in one network payload while minimizing bandwidth and request overhead.
---
title: "REST API vs GraphQL API Fetching Flow"
---
flowchart TB
    accTitle: REST and GraphQL fetching flows
    accDescr: REST gathers issue data through several requests, while GraphQL returns the requested issues, comments, and labels in one response.
    U["Client App Request"] --> Choice{"API Type"}

    Choice -->|"REST API"| R1["Request 1: Fetch Issues List"]
    R1 --> R2["Request 2: Fetch Issue Comments"]
    R2 --> R3["Request 3: Fetch Issue Labels"]
    R3 --> R4["Assemble Payload Client-side"]

    Choice -->|"GraphQL API"| G1["Single Query: Request Issues, Comments, and Labels"]
    G1 --> G2["GitHub Server Assembles Exact Payload"]
    G2 --> G3["Return Single Response"]
The flowchart demonstrates how GraphQL eliminates repeated client-server round-trips by consolidating requests into a single structured query.
Key Features of PyGitGraph
PyGitGraph provides a modular suite of Python scripts and Jupyter notebooks designed to query GitHub's GraphQL API directly.
-
Bulk Data Extraction
Extract thousands of issues with automated pagination and export directly to CSV or JSON formats for pandas analysis. -
Issue Lifecycle Management
Create, update, close, or delete multiple GitHub issues simultaneously through simple notebook workflows. -
Data Analytics Ready
Flatten complex nested GraphQL JSON payloads into tabular DataFrames ready for Matplotlib and Seaborn plotting. -
Secure Token Handling
Supports fine-grained GitHub Personal Access Tokens (PAT) and built-in rate limit tracking to avoid service throttling.
Whether you work with public open-source projects or private GitHub Enterprise instances, PyGitGraph simplifies repository metrics gathering.
Getting Started
Using PyGitGraph requires Python 3.9+ and a GitHub Personal Access Token with read/write issue permissions.
import os
import requests

# Set GraphQL API endpoint and personal access token
GRAPHQL_URL = "https://api.github.com/graphql"
TOKEN = os.getenv("GITHUB_TOKEN")  # (1)

headers = {"Authorization": f"Bearer {TOKEN}"}

# Define GraphQL query for fetching issues
query = """
query ($owner: String!, $repo: String!, $cursor: String) {
  repository(owner: $owner, name: $repo) {
    issues(first: 100, after: $cursor, orderBy: {field: CREATED_AT, direction: DESC}) {
      pageInfo {
        hasNextPage
        endCursor
      }
      nodes {
        number
        title
        state
        createdAt
        closedAt
      }
    }
  }
}
"""  # (2)
- Securely load your GitHub Personal Access Token from local environment variables.
- Formulate a structured GraphQL query requesting exact fields with cursor pagination support.
Explore PyGitGraph Notebook Tutorials
Conclusion
PyGitGraph handles cursor pagination and converts nested GraphQL responses into pandas DataFrames. That makes issue history available for trend analysis and reporting. GraphQL can reduce the number of requests when the analysis needs related fields, but the benefit depends on the query and does not provide “complete visibility” beyond the fields and permissions requested.
References and further reading
Open the complete reference catalog
Primary Sources
- PyGitGraph GitHub Repository
- GitHub GraphQL API Documentation
- Comparing GitHub REST API and GraphQL API
- pandas Documentation
Related Site Guides
- PyGitGraph Practical Use Cases - Deep dive into real-world PyGitGraph applications