Habit Tracker with PyGitGraph
Some habit-tracking apps keep records in a vendor-controlled database or limit data export. Without the raw log, you cannot easily calculate your own measures, such as monthly fasting averages or reading streaks.
This post uses GitHub Issues as the record store and PyGitGraph to export the history. GraphQL lets PyGitGraph request the required issue fields, while ordinary CSV and JSON files keep the resulting data available for your own analysis.
Navigate this post
The Personal Data Ownership Problem
Personal productivity and habit tracking tools have proliferated across mobile platforms. However, most applications lock users into proprietary database ecosystems, making long-term data analysis challenging.
- Habit Tracking
-
The systematic recording of daily routines, behaviors, or activities to monitor personal progress over time.
- Data Ownership
-
The capability to access, export, and control personal data in open formats without vendor lock-in.
- Cross-Platform Sync
-
Synchronization of state across desktop, mobile, and web interfaces using a centralized cloud backend.
- JSON Export
-
Exporting structured data in JavaScript Object Notation format for programmatic processing and visualization.
Limitations of Proprietary Habit Apps
Commercial tracking apps often restrict raw data exports behind premium paywalls. When apps lack open APIs, users cannot answer custom questions such as calculating moving averages across specific months or correlating habit completion with external work projects.
Using GitHub Issues as a Habit Store
GitHub Issues provides a reliable, version-controlled database that is accessible from any web browser or mobile app. By mapping daily habits to GitHub Issues, you gain structured tracking capabilities for free.
Under this model, each habit entry functions as a discrete issue record:
- Log a Habit: Open an issue with a descriptive title (e.g.,
Reading: 30 minutes) and attach relevant labels likereadingorwellness. - Track Completion: Close the issue when the activity completes. The timestamp of creation and closure automatically records start and end times.
- Add Metadata: Include quantitative details in the issue body, such as pages read, liters of water consumed, or fasting duration.
import pandas as pd
from pygitgraph import GitHubGraphQLClient

# Query habit tracker repository issues
client = GitHubGraphQLClient(token_env_var="GITHUB_TOKEN")
query = """
query {
  repository(owner: "kanad13", name: "habit-tracker") {
    issues(first: 100, states: [CLOSED], orderBy: {field: CREATED_AT, direction: DESC}) {
      nodes {
        title
        createdAt
        closedAt
        labels(first: 5) {
          nodes { name }
        }
      }
    }
  }
}
"""  # (1)
response = client.execute(query)  # (2)
- Queries closed habit issues with creation timestamps, closure timestamps, and category labels.
- Executes the GraphQL query using PyGitGraph and returns a structured response payload.
Visualizing Personal Habit Metrics
Once PyGitGraph extracts raw habit issues into a pandas (Python's data analysis library) DataFrame, you can construct custom visualizations using Python plotting libraries like Matplotlib and Seaborn.
| Tracking Method | Data Ownership | Cross-Platform Access | Custom Analytics | Annual Cost ($) |
|---|---|---|---|---|
| Commercial Mobile Apps | Restricted | Mobile Only | Limited Presets | 36 - 60 |
| Spreadsheets | Manual CSV | Web / Desktop | Manual Formulas | 0 |
| GitHub + PyGitGraph | Full JSON / CSV | Web / Mobile / API | Unlimited Python Analytics | 0 |
The comparison table highlights the trade-offs: combining GitHub Issues with PyGitGraph delivers complete data ownership and custom analytics capabilities at zero financial cost.
Custom Habit Analytics Dashboard
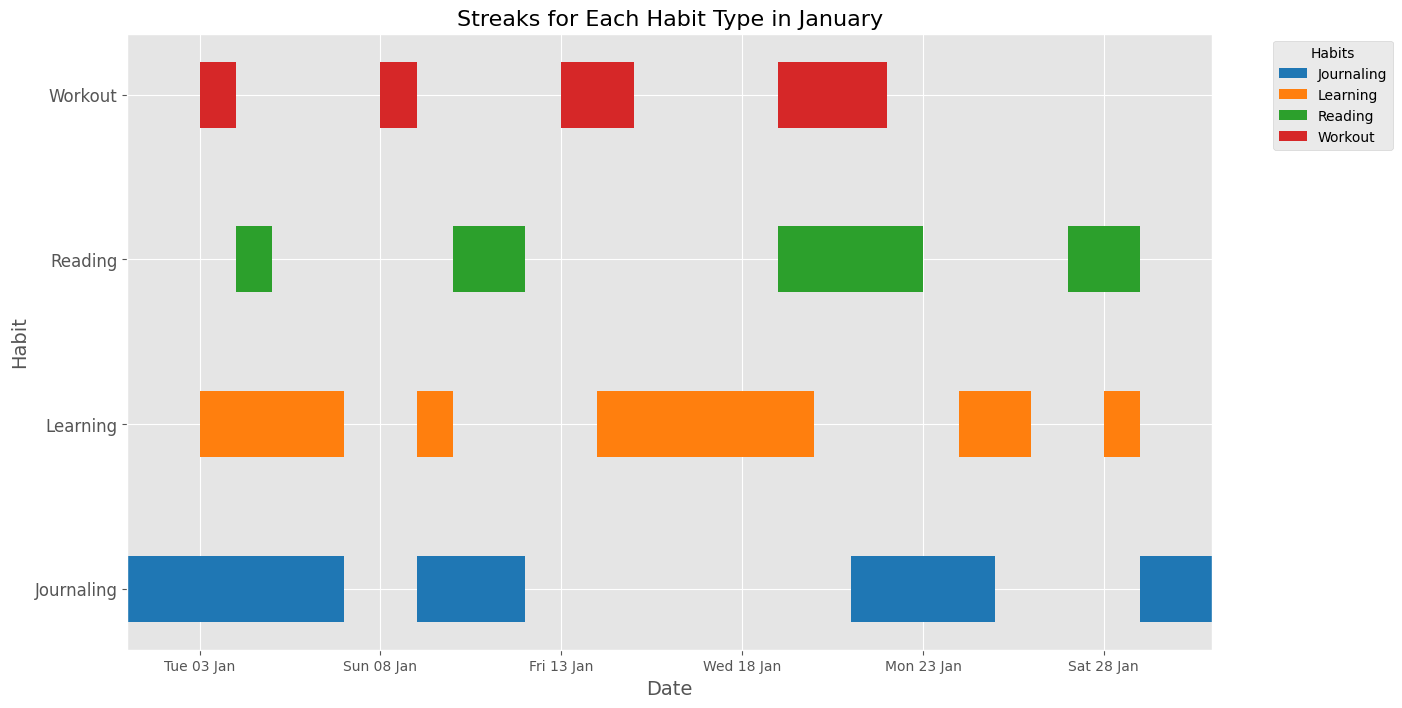
Visualize daily habit execution streaks across weeks to monitor consistency.
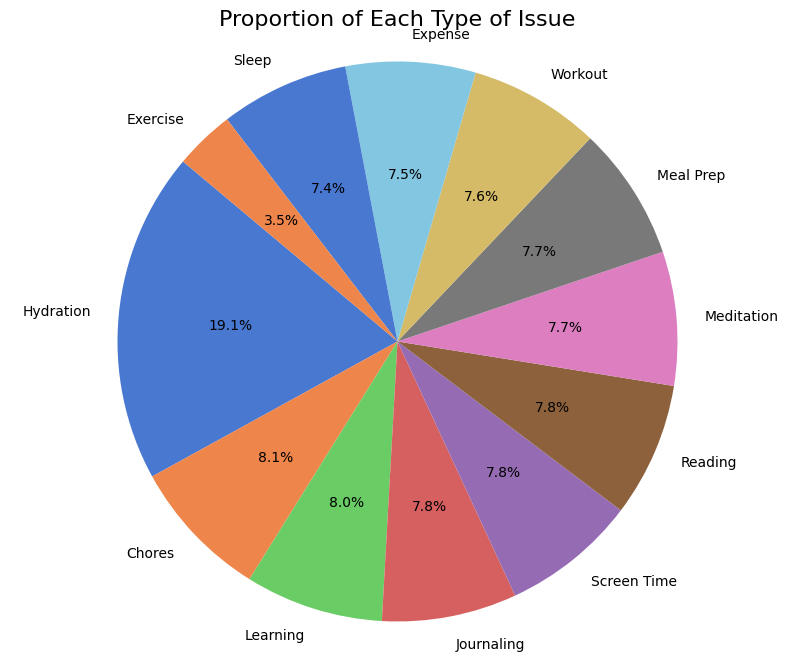
Proportion pie chart categorizing total logged habits by activity labels.
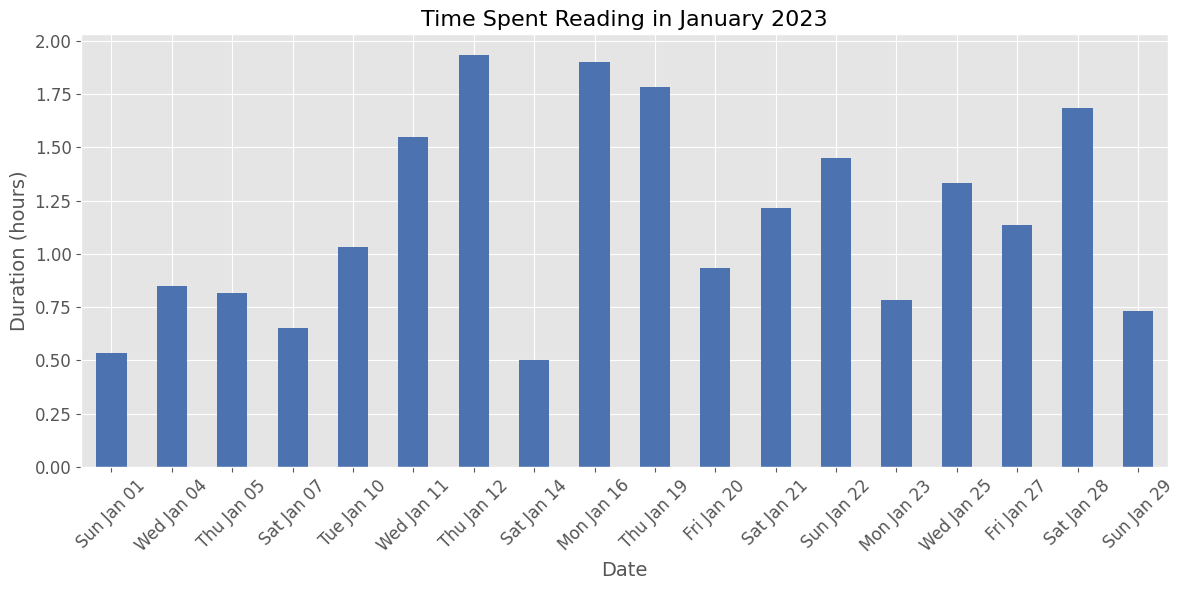
Bar chart tracking reading frequency and duration in minutes over time.
Daily water consumption log in liters and intermittent fasting hours between issue creation and closure timestamps.
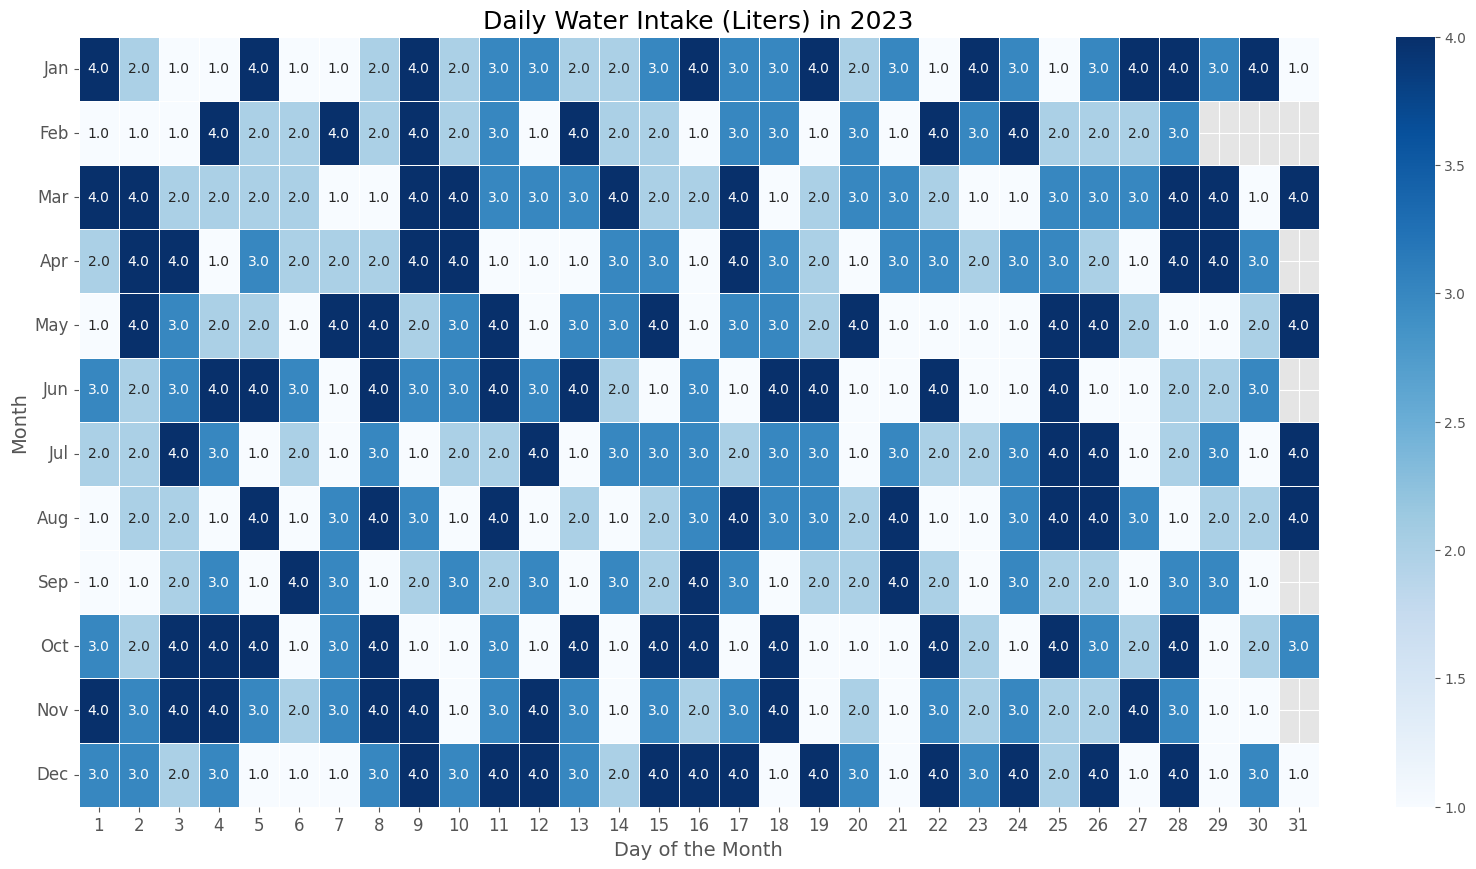
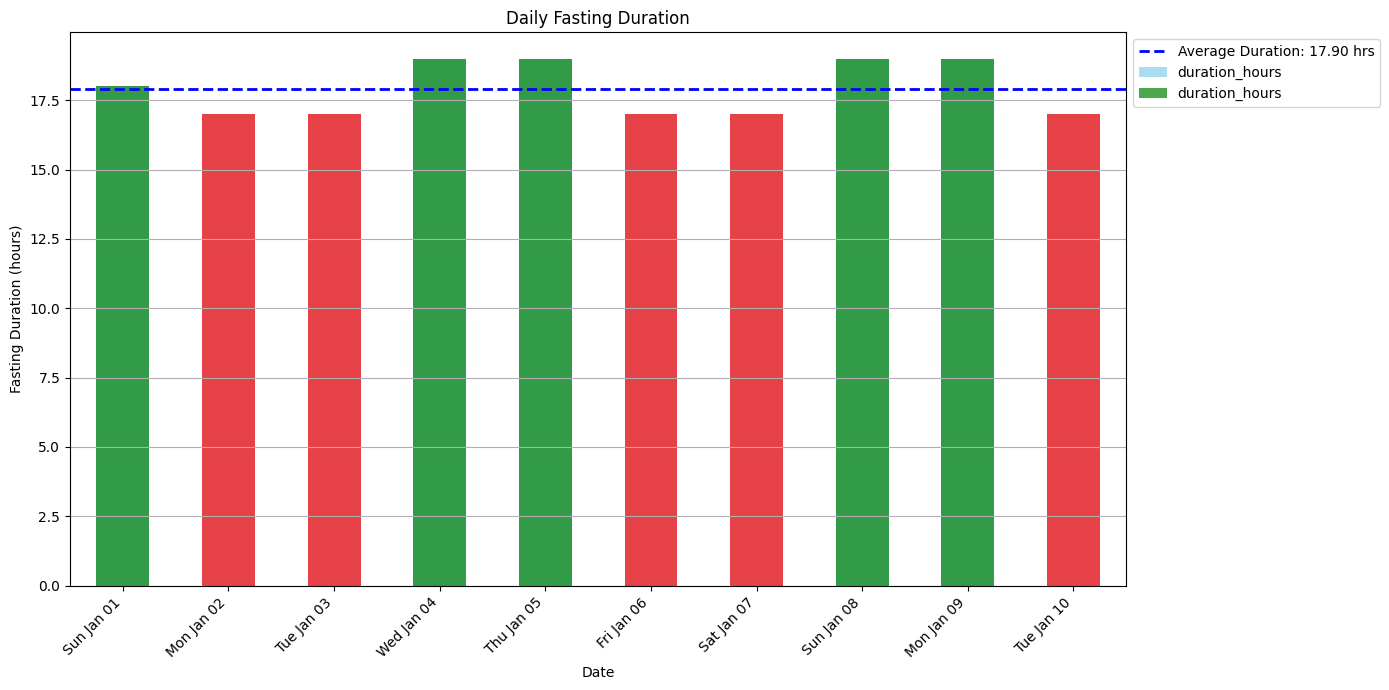
These custom charts demonstrate how raw issue timestamps convert into meaningful personal feedback loops.
Implementation Workflow
Setting up a personal habit tracker with GitHub Issues and PyGitGraph follows a four-step pipeline.
---
title: "Habit Tracking Data Pipeline with PyGitGraph"
---
flowchart TB
    accTitle: Habit tracking data pipeline with PyGitGraph
    accDescr: GitHub Issues record habits, PyGitGraph extracts the logs, pandas prepares the data, and Matplotlib creates charts.
    A["1. Create Habit Issue in GitHub"] --> B["2. Log Activity and Close Issue"]
    B --> C["3. PyGitGraph Extracts GraphQL Logs"]
    C --> D["4. pandas Transforms Data to CSV/JSON"]
    D --> E["5. Matplotlib Renders Custom Charts"]
The data pipeline above ensures that data collection remains lightweight on mobile devices while heavy analytical processing takes place in Python.
Expanding PyGitGraph Use Cases
Beyond personal habit tracking, PyGitGraph supports numerous data collection and automation scenarios.
-
Sprint Workload Monitoring
Track team sprint completion velocity, story point burn-down rates, and label distributions. -
Bug Triage and Resolution
Analyze historical defect resolution times to identify code components requiring refactoring. -
Learning and Reading Logs
Maintain structured study notes and track technical book reading progress across chapters. -
Automated Project Reporting
Generate weekly status reports automatically by querying closed milestones via GraphQL.
Explore the complete companion post on core architecture: PyGitGraph: Managing and Analyzing GitHub Issues.
Conclusion
Using GitHub Issues as a backend habit store provides a free, secure, and cross-platform solution for personal activity logging. Combining GitHub Issues with PyGitGraph unlocks full data ownership, enabling automated GraphQL extractions and custom Python analytics without relying on restrictive third-party mobile apps.
References and further reading
Open the complete reference catalog
Primary Sources
- PyGitGraph GitHub Repository
- GitHub Documentation: About GitHub Issues
- pandas Documentation: Data Manipulation Tools
Related Site Guides
- PyGitGraph Core Guide - Architectural guide to PyGitGraph and GraphQL queries